Use Case 1 – Web Content Analytics
The first use case of ASAP is centered on the information services of Internet Memory Research (IMR) as part of the Mignify platform. IMR collects, cleans and classifies data from Web, and uses the results to support its online services.
Analytic Goal
The general goal of the IMR data collection, extraction and classification processes is to build and maintain a Catalog of product references, and to discover product offers related to this catalog on public marketplaces.
- A Catalog is a tree of categories and subcategories. An example of category is Coffee machines, and a sub-category is Espresso machine.
- A Product Offer is an online proposal to sell one or several items of a product, with specific conditions such as price, delivery, etc. If, for instance, an electronic marketplace proposes 100 items of the coffee machine xxP34, at a given price YY, this constitutes a product offer for product xxP34.
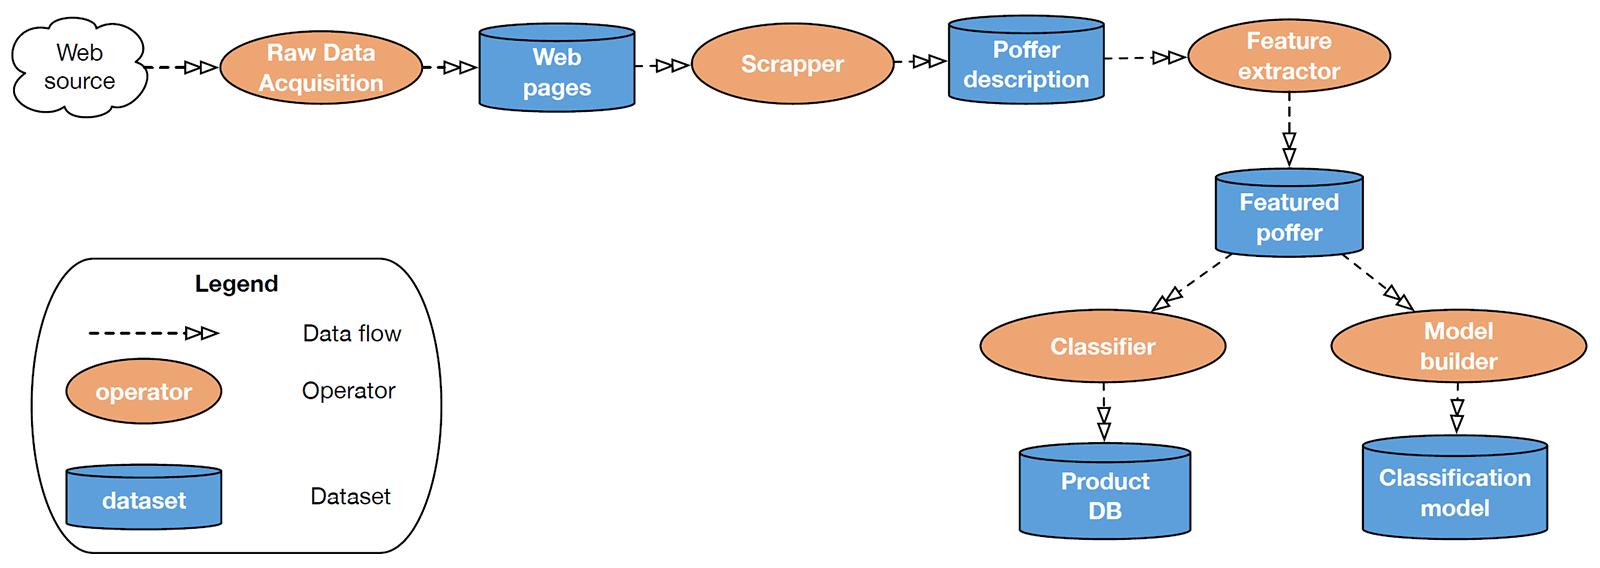
IMR maintains a Web map of classified sites that references hundreds of thousands of marketplaces. Our crawler scans the pages and identifies those that contain lists of products. Thanks to a semi-supervised approach, we then analyse the product page structure and produce a wrapper to extract a product offer record. This integrates a rich set of product-related information including brand, type, price, textual description, and user comments. Once product information has been extracted from the page, we run a classification process to predict the category of the product. The product matching operation associates product offers with product categories, given the description of offers extracted from e-marketplaces.
Information Services
IMR maintains and expands a large database of classified product offers. This ProductDB database supports several services which can be split in two main categories depending on their target users:
- Presence is a B2B service that takes advantage of the ProductDB database to provide competitive intelligence. The service offers a public interface that lists of eCommerce sites where a specific brand can be found. Sellers can get specific data on their brand and analyse their main competitors.
- Bomerce is a price comparison application for Web and mobile devices. When exploring online offers for products or services, users are confronted with heterogeneous offers from proprietary eCommerce sites. Bomerce helps to compare such offers and seek third-party advice, sends out of notifications in the case of promotions, and checks the reputation of an eCommerce site.
Both Presence and Bomerce depend on the quality of the ProductDB database, and therefore on the data acquisition, extraction and classification workflow. We modeled and implemented our data processing workflow with ASAP. First, a an abstract workflow has been defined. It gives a complete high-level view of the various steps involved in the transformation that transforms raw Web pages into structured and classified product descriptions. This abstract workflow is then implemented through concrete operators taken from the ASAP library.

Interactive Exploration
The ASAP Dashboard demonstrates the potential of big data technologies in conjunction with advanced visual analytics to automatically transform noisy, unstructured Web content into valuable repositories of actionable knowledge. Processing dynamic content streams from multiple sources and extracting metadata attributes from the product offers, it extends price comparisons by:
- Visualizing aggregated keywords computed from noisy textual descriptions contained in the product offers collected by IMR; identifying the leading sources of these offers, including an analysis of keywords that e-commerce sites associate with specific products or an entire product category; Exploring product features that impact brand reputation and the perception of a product in online media coverage (news channels vs. social media vs. product offers), creating additional value for sales and marketing decision makers.
- Providing metadata dimensions such as sentiment, which indicates whether a feature is mainly perceived as a unique selling proposition that causes satisfaction, or a hygiene factor that causes dissatisfaction. This distinction is an important source of feedback to compute a dynamic success metric and guide strategic marketing decisions.
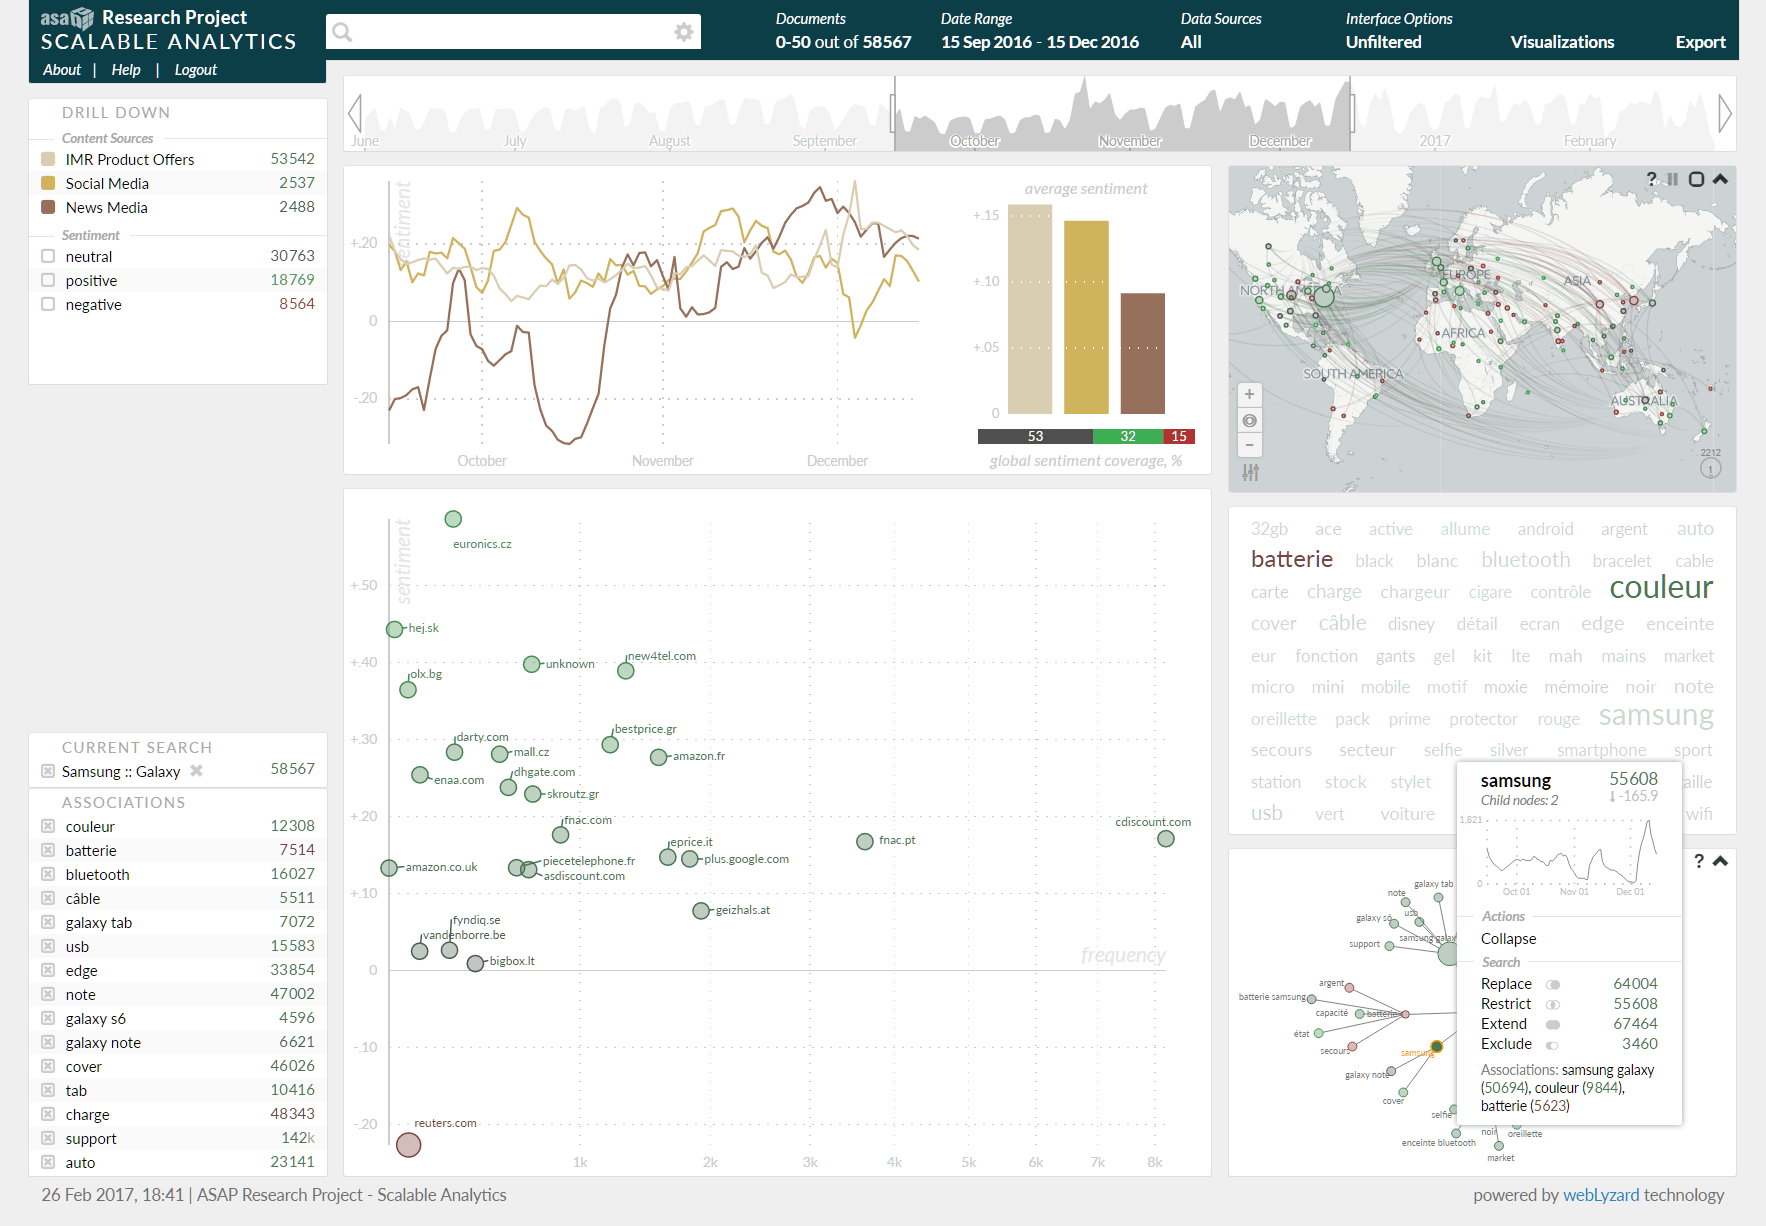
For a business intelligence tool to complement price comparisons, such metadata dimensions are particularly important. The drilldown sidebar of the ASAP dashboard shown in the figure below helps to better understand the temporal distribution of metadata attributes. The line chart in the shown example compares the average sentiment for the Samsung Galaxy series by source (product offers, social media, news media). The bar chart presents the same data in aggregated form, and the scatter plot maps the frequency vs. sentiment matrix of the major content sources. The geographic map projects the entire set of search results. The adaptive tooltip in the lower right corner enables on-the-fly query refinements – either to Replace the search query with a new term, or to apply the Boolean operators AND (Restrict), OR (Extend), AND NOT (Exclude). Using the dashboard’s view synchronization mechanism, the tooltip is tightly coupled with the tag cloud – which highlights the product features ”color” and ”battery” as the strongest associations with the hovered keyword “Samsung”.